

An AI Detector for Fraudulent and Damaged Returns at an Online Beauty Retailer
We built a computer-vision and multimodal return-verification system for a multi-country online beauty retailer, helping distinguish genuine damage, fulfillment errors, and suspicious return patterns while reducing unnecessary manual review.

An AI Detector for Fraudulent and Damaged Returns at an Online Beauty Retailer
Industry: E-commerce, beauty retail, multi-country European market
Project type: Computer vision, multimodal models, unstructured data analysis
Status: pilot live in several countries; project in active development
The Problem
The retailer operates entirely online, with no physical locations to handle returns in person. Certain SKUs and brands consistently show an anomalously high return rate, and that hits margin in several places at once: the company covers return shipping, and under EU regulation a share of returned items — particularly anything filed under "caused an allergic reaction" — can't legally be resold. There's a separate disposal cost on top of that.
Within total return volume, there's a subset that can loosely be called fraud — not always malicious deception, more often a misrepresentation of the actual reason for the return.
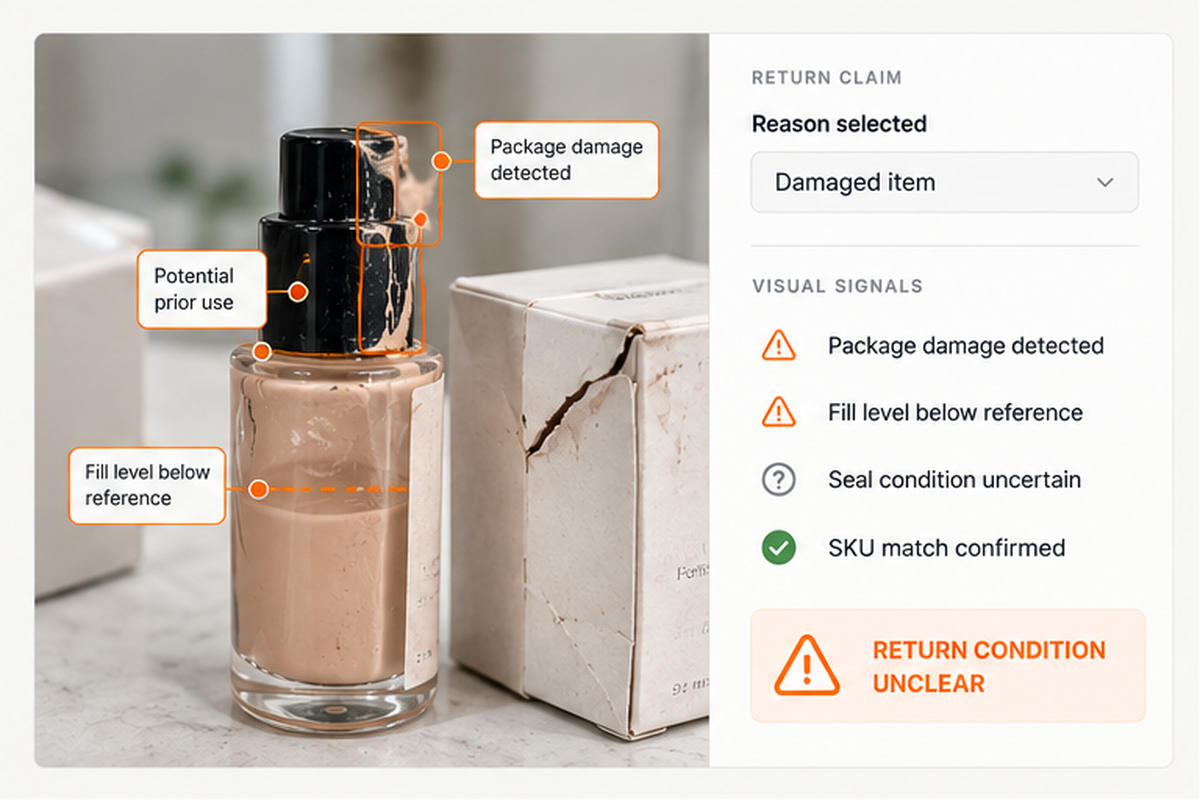
Wardrobing. A product gets used for nearly its entire legal return window — 13 of 14 days, say — then comes back marked "didn't like it," even though it's already been used.
Partial depletion. Some of the contents get poured out of a bottle or tube, sometimes diluted, and the packaging is returned as if unopened.
Genuine manufacturing defects. A missing component — a mirror in an eyeshadow palette, for instance — or packaging damaged in transit.
Fulfillment error. The customer receives the wrong shade or the wrong item entirely — the retailer's fault, not the customer's.
EU regulation imposes a standard structure across the market: return reasons are limited to a fixed list of 7–8 categories, and the customer has to select one when filing a claim.
The Solution
Prioritizing problem SKUs. Historical data identifies which products and brands carry the highest share of anomalous returns. The data volume is large, but the analysis itself is straightforward — count return frequency by SKU, sort, flag the priority zone for further work.
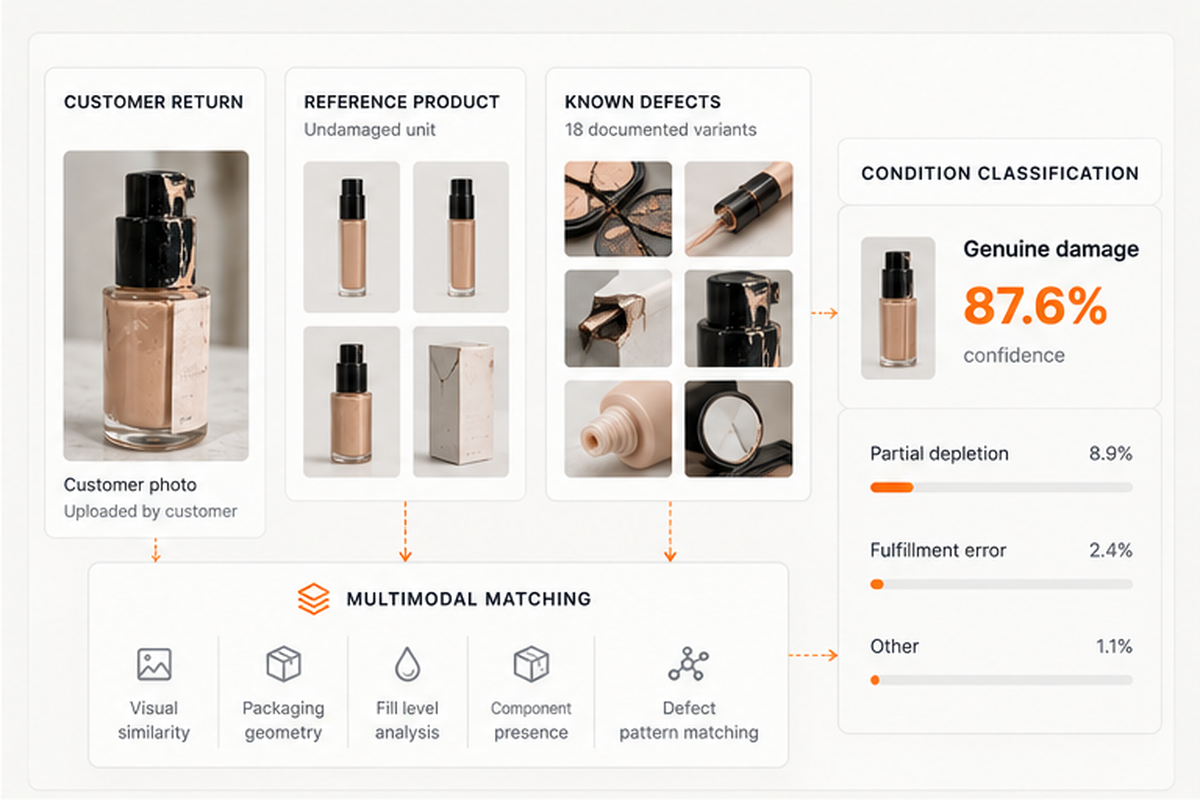
A library of reference images and known defects. For priority SKUs, the team builds a reference image set showing the product from multiple angles — what a genuine, undamaged unit looks like. In parallel, a library of real defects gets assembled: some pulled from historical returns, some created deliberately (a packaging element is physically damaged and photographed for the dataset), some sourced from public images — customer complaint photos on social media, for example. The range of defect variations per SKU typically runs 15–20, depending on the product's complexity.
Multimodal matching. When a customer files a return, they photograph the item. That photo gets matched simultaneously against the reference image and the known-defect library through a multimodal model. The output isn't a binary answer — it's a probability: "87.6% confidence this is genuine damage," for example.
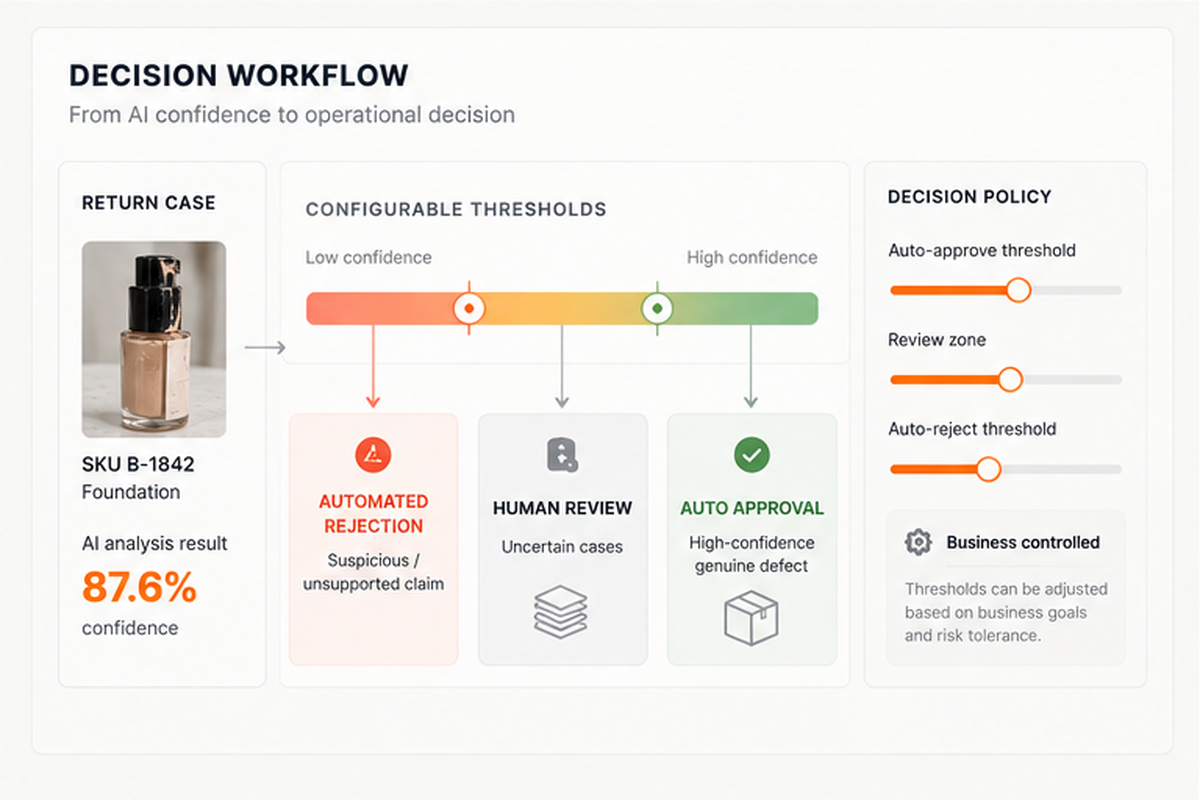
A tunable decision threshold. The business sets the confidence level at which a return gets auto-approved, auto-rejected, or routed to a human reviewer in the contact center. That's a direct lever on the trade-off between automation speed and decision accuracy — and since every contact-center touch costs real money, minimizing the share of cases that need human review translates straight into savings.
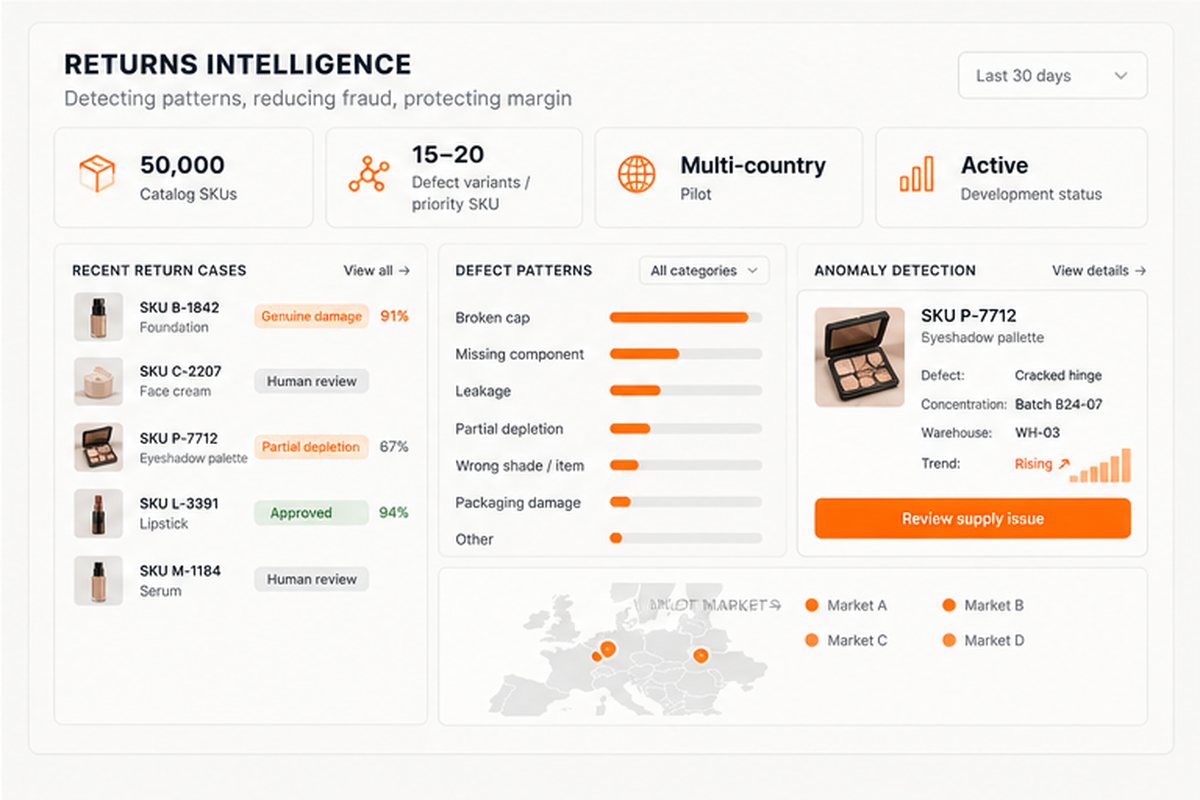
Proactive brand outreach. If the system detects a spike in a specific type of defect concentrated in one SKU — traceable to a single supply batch or warehouse, say — the retailer can flag it to the brand before scattered complaints turn into a wave, and before the reputational cost lands (customers blame the retailer, not the manufacturer, since the retailer is the one they interact with).
Directions discussed but not built. Video verification for customers with suspiciously frequent returns — asking for a short unboxing video instead of a static photo, which is harder to fake. And personalized recommendations for customers who report an allergic reaction — offering to help them find an alternative product suited to their specific skin sensitivity, turning a negative experience into a retention moment.
Why Not Just Call a Foundation Model API Instead of Training a Custom One
The team considered and rejected processing every photo through an off-the-shelf model API (GPT, Claude, Gemini) instead of training one in-house.
For a small shop, that approach is probably the right call. For a retailer processing millions of photos, it isn't — for two reasons. Economics: the API cost at that volume is a multiple of what it costs to run and maintain a purpose-built model. Dependency risk: a third-party model can change without notice, accuracy can quietly degrade, and you find out after the fact from the numbers, not from an alert. On top of that, sending customer photos — including potentially sensitive ones, like images documenting a skin reaction — to a third-party provider's servers raises its own questions under European data protection rules.
Results
The project was in pilot across several countries as of this writing. No finalized outcome metrics yet — the expected impact is inferred from the mechanics of the solution itself: a higher share of returns processed automatically without contact-center involvement, and a lower volume of product written off due to unjustified returns.
Scale and Team
The catalog runs to roughly 50,000 SKUs, of which the priority analysis covers the top slice by return volume — estimated anywhere from a few hundred to a couple thousand SKUs depending on the cut used.
Team required to build something comparable from scratch: 2 data scientists, roughly 1.5 backend engineers, 1 product manager. Timeline: 6–9 months. Estimated budget: €700,000–1,000,000 for a large multi-country retailer.
