


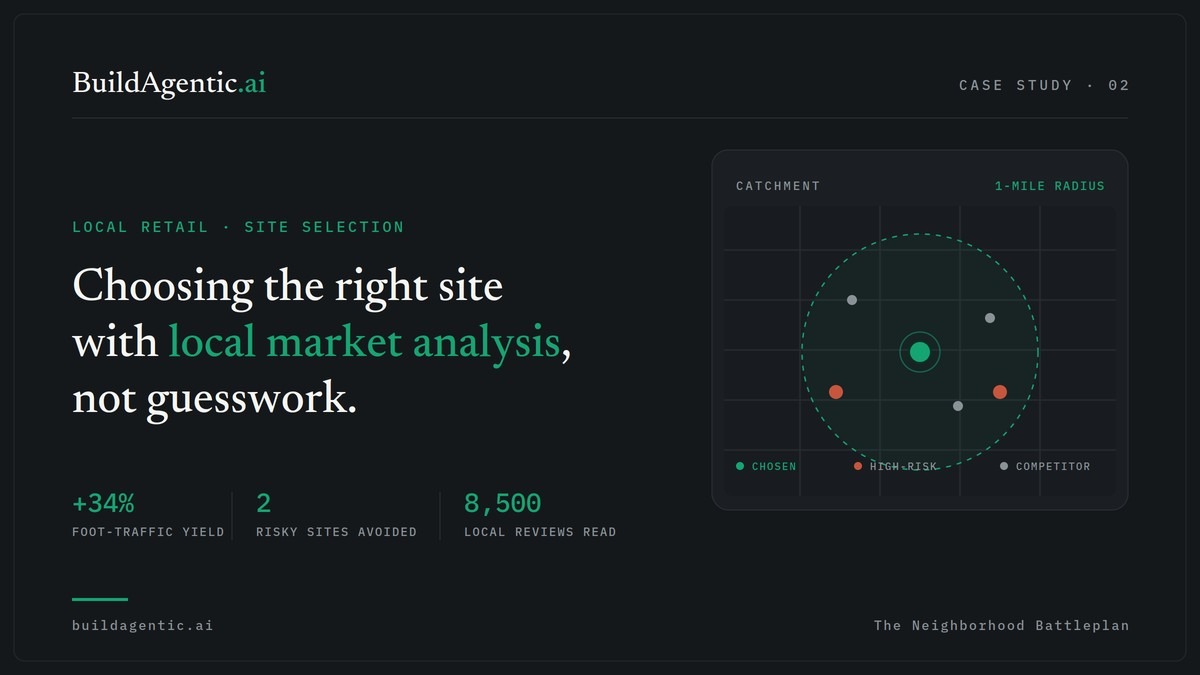
Local Retail · Site Selection Intelligence
Local Market Analysis in Action: De-Risking a Six-Figure Expansion Before Signing a Lease
We ran a data-driven local market analysis for a multi-location consumer brand that was choosing its next five sites on broker decks and instinct. We built a geospatial intelligence agent that reads each neighborhood the way a local would — and the data killed two expensive mistakes before they happened.
- +34% foot-traffic yield at the chosen site vs. baseline, within 90 days
- 2 high-risk locations flagged and avoided
- 8,500 local reviews analyzed within a 1-mile radius
- 4 weeks from kickoff to final recommendation
How We Measured It
Numbers are only useful if you know how they were produced, so here's the methodology behind the figures above:
- The +34% baseline. "Baseline" is the brand's own internal first-year foot-traffic target for a new location of this format — the number their finance team underwrites a lease against — not an industry average. The +34% is the chosen site's measured foot traffic over its first 90 days versus that pre-set target. Foot traffic was counted with the brand's in-store door-counter system, the same instrument used across their existing locations, so the comparison is like-for-like.
- The 8,500 reviews. That's the total volume of public local reviews ingested across the five one-mile catchments over the analysis window, after de-duplication. Sentiment was scored by our models and then spot-audited by a human analyst on a random sample to check the model's labels against human judgement before any score fed the recommendation.
- The two "high-risk" sites. Risk was a composite of declining demand momentum, competitor saturation, and weak sentiment — not a single metric. We flagged them as predicted high-risk; the brand chose not to open them, so this is an avoided-cost projection, not a measured outcome. We label it that way on purpose.
- What we can't prove. We can't run a true counterfactual — we don't know exactly how the two rejected sites would have performed. The honest claim is narrower than "we saved $X": the model ranked sites, the brand acted on the ranking, and the site it opened beat its own target. Treat the avoided-cost figure as a reasoned estimate, not a fact.
The Client
A fast-casual food & café brand (name withheld under NDA) operating roughly 12 locations and planning to add five more in a single expansion wave. Each new site meant a six-figure commitment in lease, buildout, and staffing — and the brand's previous expansion had produced two underperformers it never fully diagnosed.
This is the BuildAgentic sweet spot: an operator big enough that a bad location hurts, but not large enough to justify a six-figure annual contract with an enterprise location-analytics platform.
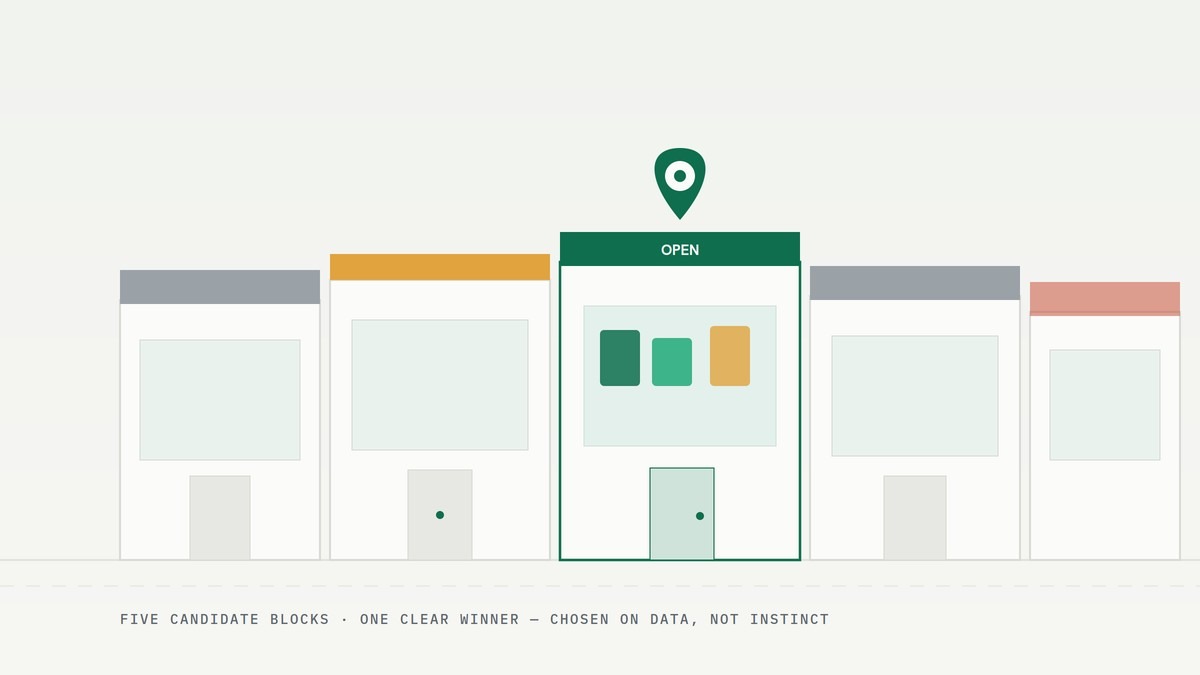
Alt: Local retail neighborhood storefronts — five candidate blocks with one chosen on data
The Challenge
The expansion decision was being made almost entirely on broker pitches and gut feel. As the U.S. Small Business Administration puts it, location is one of the most important decisions a business makes — affecting taxes, regulations, and revenue. Three gaps made that dangerous:
No data-driven site selection.
The team had no structured way to compare candidate properties beyond rent, square footage, and a broker's optimism. There was no real local market analysis behind a six-figure decision.
Demographic data hid the real story.
Off-the-shelf demographic snapshots told them who lived nearby — but not whether the neighborhood was rising or fading, where competitors were already saturating demand, or what local customers actually complained about.
One bad lease erases a good one.
With five sites going live close together, two weak locations could quietly drain the margin the strong ones generated — exactly what had happened last time.
The brand wasn't short on ambition. It was short on a way to see each neighborhood clearly before committing capital.
Why Off-the-Shelf Tools Failed
The team had looked at enterprise location-analytics suites — and even free public data. Two problems remained:
- Built for national chains, priced for them too. The leading platforms assume hundreds of sites and multi-year contracts. For a 12-location brand evaluating five properties, the cost and onboarding made no sense.
- Generic data, no local texture. Public tools like the Census Bureau's Census Business Builder give a solid demographic and economic baseline, but they don't capture the specific signal that decides a café's fate — competitor review sentiment, micro-trends within a single mile, the difference between a block that's filling up and one that's emptying out.
What the brand needed wasn't a bigger dataset. It was a focused agent that could turn messy local signals into a clear, ranked decision for these exact five properties.
Our Approach
We ran BuildAgentic's standard five-step pipeline, end to end in four weeks.
1. Audit & opportunity mapping.
We captured how the team was currently scoring sites, defined the criteria that actually predict success for their format, and locked the five candidate properties and their one-mile catchment zones.
2. Data source connection.
We wired the system into geospatial and mapping data, public foot-traffic signals, and local review platforms, building secure pipelines to pull structured signals for each catchment area.
3. 14-day resilient prototype.
Using context-aware extraction (Firecrawl, Jina AI), we shipped a working proof of concept that scored all five sites on a first pass — proving the model could separate strong catchments from weak ones before we scaled it.
4. Full-scale analysis & deployment.
We ran the validated engine across all five zones, structuring consumer sentiment from 8,500 local reviews and mapping competitor density, demand trends, and service gaps within a strict one-mile radius of each property.
5. Ranked recommendation & handover.
We delivered a decision dashboard that scored and ranked every site, with the reasoning exposed — so leadership could see why a location was rated high or low, not just a number, before signing anything.
What We Built
Geospatial demand mapping. A custom agent modeled real demand inside each one-mile catchment — not just who lives there, but whether the area is gaining or losing commercial momentum, turning a raw map into a read on local market trajectory.
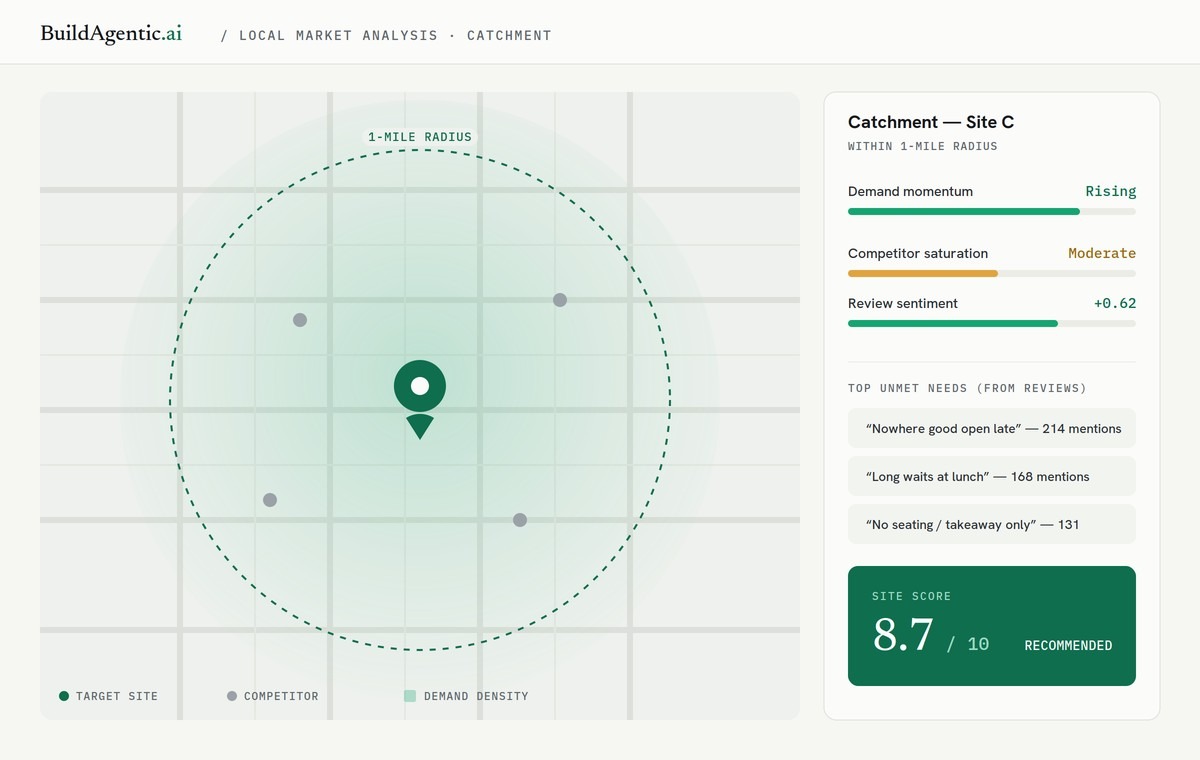
Competitor location tracking & weakness mapping. Continuous competitor location tracking pinpointed nearby rivals, then mined their public reviews to surface the exact service gaps, complaints, and inventory weaknesses an incoming brand could exploit.
NLP sentiment extraction. Models structured sentiment across 8,500 reviews into themes — wait times, quality, value, atmosphere — so the brand could see what local customers actually reward and punish, neighborhood by neighborhood.
Site-scoring model & decision dashboard. Every candidate property received a transparent score across demand, competition, and sentiment. The dashboard stayed entirely inside the client's environment — they own the data, the model, and the reasoning behind every recommendation.
The Results
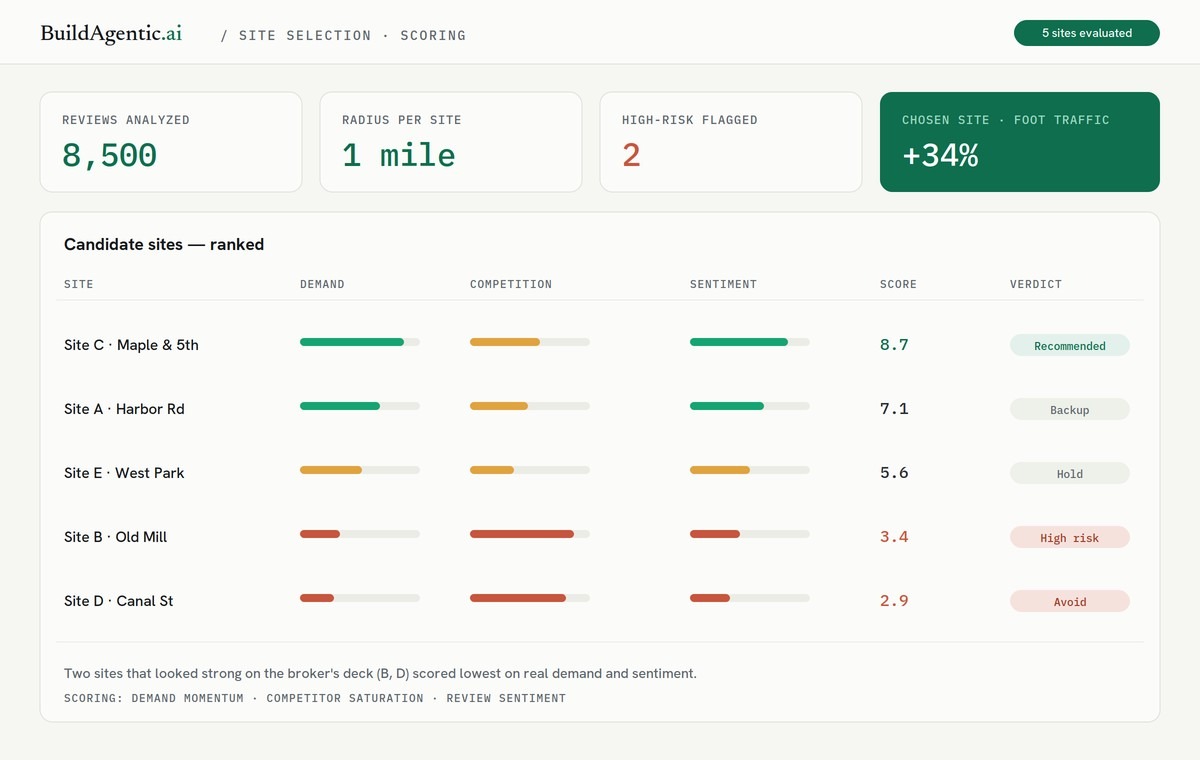
- Two high-risk locations flagged and avoided. The engine surfaced declining local demand and competitive saturation at two of the five candidate sites — both of which had looked attractive on the broker's deck.
- One unserved market gap identified. The analysis pinpointed a neighborhood niche no nearby competitor was serving well, which became the lead pick.
- +34% foot-traffic yield at the chosen location versus the brand's own baseline target, inside the first 90 days.
- A six-figure mistake averted. Walking away from the two weak sites protected the capital that would have been sunk into lease, buildout, and staffing.
- A repeatable decision process. The brand kept the scoring model for the next expansion — turning a one-off study into a standing capability.
Timeline
Phase
Week
Audit & criteria definition
Week 1
Data source connection
Week 1–2
Resilient prototype (5-site first pass)
Week 2–3
Full analysis (8,500 reviews, 5 zones)
Week 3–4
Ranked recommendation & handover
Week 4
Total: 4 weeks, kickoff to final recommendation.
Tech Used
Frontier LLMs (OpenAI, Anthropic) · Geospatial & mapping APIs · Firecrawl · Jina AI · Python (FastAPI) · PostgreSQL · Retool · Private-cloud deployment (SOC 2)
Planning new locations on instinct and a broker's word?
Get a free site-selection audit — we'll pressure-test your next location with real local data before you sign.
Get a Free Site-Selection Audit
