


E-Commerce · Returns Reduction
Reduce Ecommerce Returns in Action: How an Apparel Brand Cut Size-Driven Returns by 24%
To reduce ecommerce returns without slashing prices, we built custom returns analytics for a mid-market apparel brand - AI that reads every return note, finds the real reason behind each send-back, and fixes the listings that cause them. In roughly five weeks, size-driven returns fell 24%, and the brand recovered an estimated $130K in annual margin.
- −24% size-driven returns in 90 days
- $130K annual margin recovered
- 15,000 return notes & reviews mined
- 5 weeks from kickoff to live
These figures illustrate a representative engagement (anonymized under NDA) — not a single audited client result. The methodology is below; we share real, client-specific numbers on a call.
How We Measured It
So the numbers above mean something; here's how they were produced:
- The −24%. "Size-driven returns" is a defined subset of returns tagged as fit/sizing on an instrumented SKU set. We compare the 90 days after the listing fixes against the prior 90-day baseline, adjusted for seasonality.
- The $130K. Annualized from the per-SKU margin saved on avoided returns — product cost + return shipping + restocking + depreciated resale value — using the client's own cost inputs, not list prices.
- The 15,000. The count of return notes, support tickets, and product reviews ingested and classified by the reason-mining engine.
- On honesty. The figures on this page illustrate a representative engagement — anonymized under NDA — not a single audited client statistic. We publish the exact methodology so you can judge the approach, and we'll walk you through real, client-specific numbers on a call.
The Client
A mid-market apparel & accessories DTC brand (name withheld under NDA), selling across Shopify Plus with a catalog of roughly 3,000 SKUs. Returns sat around 26% — normal for apparel, but high enough to quietly eat the margin on every fast-moving style.
That puts them squarely in our sweet spot — past the point where reading return notes by hand scales, but not ready to buy a bloated, logistics-only enterprise platform priced for brands ten times their size.
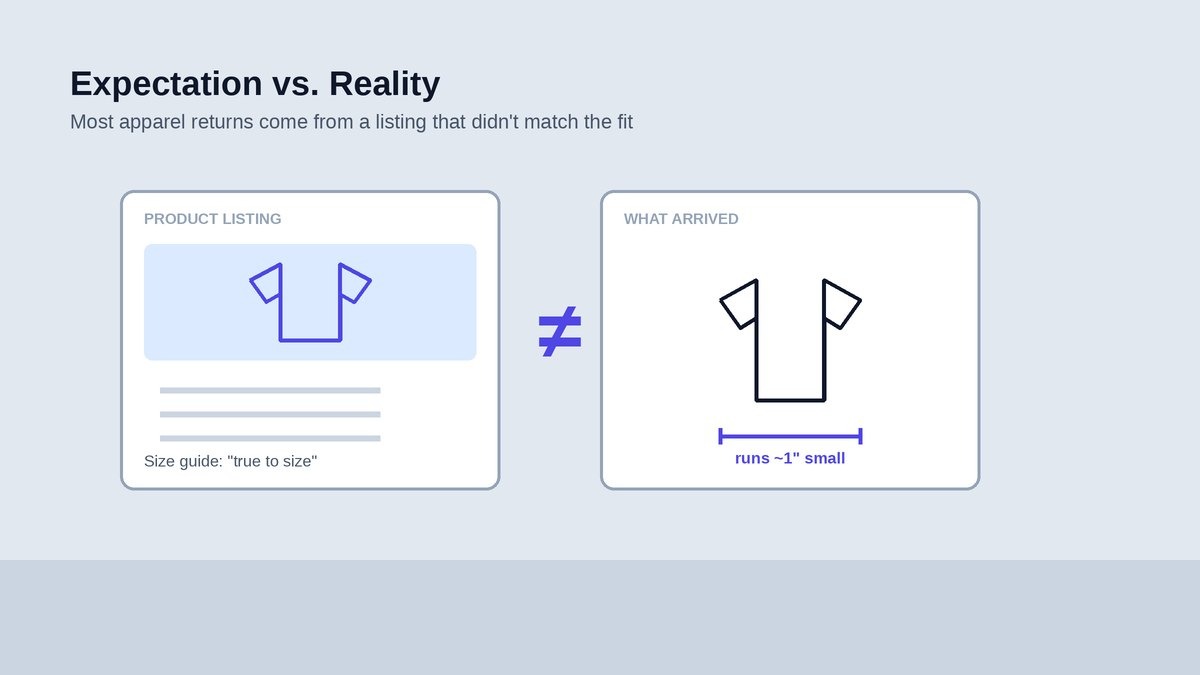
Caption: The core job: close the gap between what the listing promises and what arrives in the box.
The Challenge
The brand competed in categories where fit makes or breaks the sale — and where a sizing mismatch turns into a return, a refund, and a depreciated unit. Three problems compounded:
The return rate was stuck near 26%. High enough to erase margin on the brand's best sellers, but treated as an unavoidable "cost of doing apparel online."
The real reasons were invisible. The "why" behind each return was buried in thousands of free-text notes and reviews that nobody had the hours to read at scale.
Insights never reached the listing team. Two CX staff skimmed a fraction of notes manually; whatever they learned rarely made it back into the product descriptions and size charts that caused the problem.
The cumulative effect was a quiet, continuous margin leak: the same sizing complaints repeating across the same SKUs, season after season.
Why Off-the-Shelf Tools Failed
The brand had already tried boxed returns apps. Two structural limits kept biting:
- They're label-printers. Standard Shopify returns apps run on linear logic — issue a refund, print a label. They tell you that a product came back, never why, so nothing upstream ever changes.
- Enterprise SaaS solves the wrong half. Platforms like Loop Returns and Narvar optimize the logistics of moving a box backward. That's reverse-logistics convenience, not return prevention — and it's priced for brands far larger than this one.
An enterprise returns suite could have handled the portal, but at a cost and rollout that made no sense for a 3,000-SKU catalog and a two-person CX team that mostly needed to know what to fix.
Our Approach
We ran BuildAgentic's standard five-step pipeline, end to end in about five weeks.
1. Margin-bleed audit & opportunity mapping.
We pulled historical returns, support tickets, and reviews, and quantified which SKUs and which reasons were costing the most margin — so the build targeted the worst offenders first.
2. Storefront & data connection.
We built secure pipelines into Shopify Plus, the helpdesk, and the review platform to read return notes, order data, and product listings, and to safely stage listing updates for review.
3. 14-day resilient prototype.
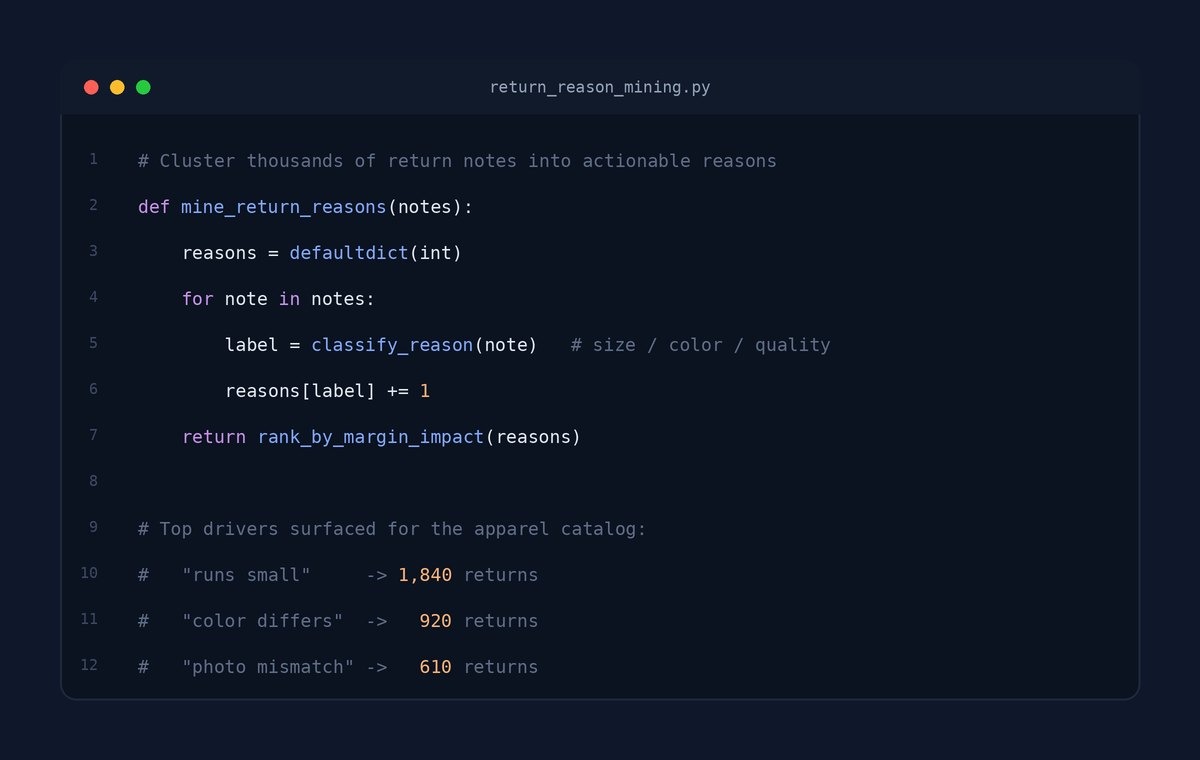
Using frontier LLMs, we stood up a reason-mining engine that reads each free-text note semantically and clusters it into ranked, margin-weighted reasons — no brittle keyword rules.
4. Private-cloud deployment.
We scaled the validated system inside the client's private cloud perimeter, fully SOC 2 compliant, so proprietary returns and customer data never left their control.
5. Live, guarded activation.
We switched on automated listing and size-guide suggestions only behind human approval — every customer-facing change is reviewed by the team before it ships.
What We Built
Reason-mining NLP engine.
Instead of counting return codes, the system reads the actual notes and reviews, clusters them into specific reasons ("runs small", "color differs from photo", "fabric thinner than expected"), and ranks each by the margin it's bleeding.
Automated listing & size-guide fixer.
For the worst-offending SKUs, the engine drafts corrected descriptions and size-chart updates that close the expectation gap — queued for the team to approve, not auto-published.
Returns analytics dashboard.
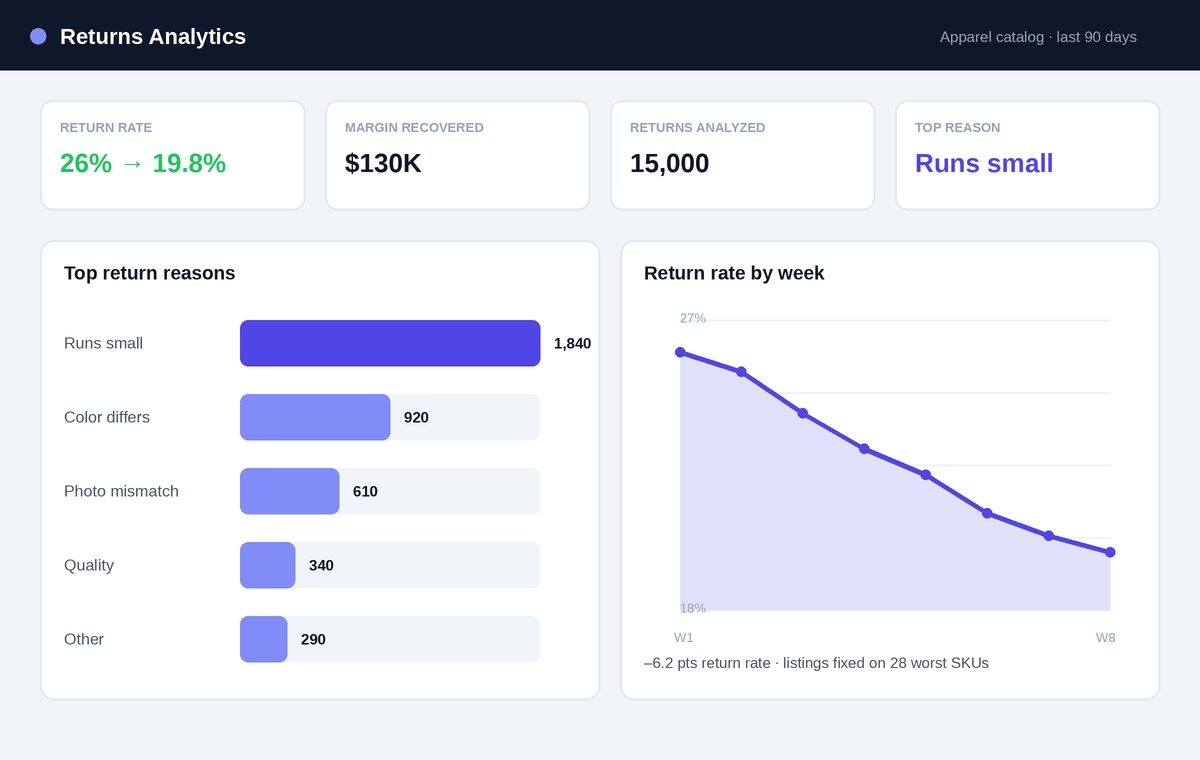
A clean interface shows the live return-reason mix, return rate by SKU, and recovered margin — turning a pile of complaints into a prioritized fix list.
The Results
- −24% size-driven returns on the instrumented SKUs within the first 90 days, by fixing the listings that caused them.
- $130K in annual margin recovered, from returns avoided rather than discounts given.
- Return rate down from 26% to ~19.8% on the worst-offending categories.
- 15,000 return notes turned into a ranked fix list, so the listing team finally knew exactly what to change.
- ~20 hours/week of manual note-reading eliminated, freeing CX for actual customer work.
By the client's own cost inputs, the recovered margin alone covered the build cost within the first quarter.
Timeline
Phase
Weeks
Margin-bleed audit & opportunity mapping
Week 1
Storefront & data connection
Weeks 1–2
Resilient reason-mining prototype (PoC)
Weeks 2–4
Private-cloud deployment
Week 4
Guarded activation & handover
Week 5
Total: ~5 weeks, kickoff to live.
Tech Used
Frontier LLMs (OpenAI, Anthropic) · Python (FastAPI) · PostgreSQL · secure low-code dashboards
Bleeding margin to returns you can't explain?
Get a free returns-margin audit — we'll mine a sample of your return notes and show you exactly which listings are costing you the most.
Get a Free Returns-Margin Audit
FAQ
Q: How much can AI realistically reduce e-commerce returns?
A: It depends on your return drivers, but when returns are driven by sizing and listing mismatches, fixing the worst-offending listings typically cuts those returns by a double-digit percentage within a quarter. The wider the gap between listing and reality, the larger the gain.
Q: How long does a returns-reduction build take?
A: A working prototype on your real return notes is usually live within about two weeks, and full deployment in roughly four to six weeks, depending on catalog size and integrations.
Related case studies
